List of Belgian provinces by GDP
Jump to navigation
Jump to search
This article lists Belgian provinces and regions (NUTS 2) by gross domestic product (GDP).
By GDP
This table reports the gross domestic product (nominal GDP), expressed in billions of euro, of the ten provinces and the Brussels capital region in 2019.[1]
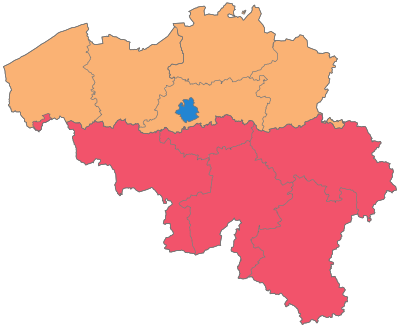
Flemish Region Walloon Region
| Rank | Province | GDP in bn. EUR |
|---|---|---|
| 1 | 92,088 | |
| - | 86,650 | |
| 2 | 57,559 | |
| 3 | 51,750 | |
| 4 | 48,326 | |
| 5 | 35,041 | |
| 6 | 32,720 | |
| 7 | 29,502 | |
| 8 | 21,024 | |
| 9 | 13,906 | |
| 10 | 7,351 | |
| 476,203 |
By GDP per capita
This table reports the gross domestic product (adjusted for purchasing power parity), expressed in euro, of the ten provinces and the Brussels capital region in 2018.[2]
Flemish Region Walloon Region
| Rank | Province | GDP per capita in EUR |
|---|---|---|
| - | 71,100 | |
| 1 | 51,800 | |
| 2 | 49,300 | |
| 3 | 44,900 | |
| 4 | 40,300 | |
| 5 | 37,800 | |
| 6 | 33,600 | |
| 7 | 29,400 | |
| 8 | 27,900 | |
| 9 | 26,000 | |
| 10 | 25,500 | |
| 41,400 |