Northumberland County Council elections
This article needs additional citations for verification. (June 2018) |
Northumberland County Council elections are held every four years. Northumberland County Council is the local authority for the unitary authority of Northumberland in England. Since the last boundary changes in 2013, 67 councillors have been elected from 66 wards.[1]
Political control
Northumberland County Council was first created in 1889. Its powers and responsibilities were significantly reformed under the Local Government Act 1972, with a new council elected in 1973 to act as a shadow authority ahead of the new powers coming into force in 1974. It became a unitary authority in 2009, taking over the functions previously exercised by the county's district councils, which were abolished. Since 1973, political control of the council has been held by the following parties:[2][3][4]
Non-metropolitan county
| Party in control | Years | |
|---|---|---|
| No overall control | 1973–1981 | |
| Labour | 1981–1985 | |
| No overall control | 1985–1989 | |
| Labour | 1989–2008 | |
| No overall control | 2008–2009 | |
Unitary authority
| Party in control | Years | |
|---|---|---|
| No overall control | 2009–2021 | |
| Conservative | 2021–2021 | |
| No overall control | 2021–present | |
Leadership
The leaders of the council since 2013 have been:[5]
| Councillor | Party | From | To | |
|---|---|---|---|---|
| Grant Davey[6] | Labour | 2013 | 24 May 2017 | |
| Peter Jackson | Conservative | 24 May 2017 | 2 Sep 2020 | |
| Glen Sanderson | Conservative | 23 Sep 2020 | ||
Council elections
- 1973 Northumberland County Council election
- 1977 Northumberland County Council election
- 1981 Northumberland County Council election
- 1985 Northumberland County Council election
- 1989 Northumberland County Council election
- 1993 Northumberland County Council election
- 1997 Northumberland County Council election
- 2001 Northumberland County Council election
- 2005 Northumberland County Council election
- 2008 Northumberland County Council election
- 2013 Northumberland County Council election
- 2017 Northumberland County Council election
- 2021 Northumberland County Council election
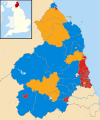
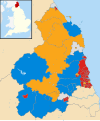
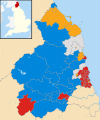
County result maps

1981 results map

1985 results map
1989 results map
1993 results map

1997 results map
2001 results map

2005 results map

2008 results map

2013 results map

2017 results map

2021 results map


By-election results
| Party | Candidate | Votes | % | ±% | |
|---|---|---|---|---|---|
| Conservative | 546 | 35.8 | +0.5 | ||
| Liberal Democrats | 420 | 27.5 | -9.6 | ||
| Labour | 307 | 20.1 | -7.5 | ||
| Independent | 253 | 16.8 | +16.8 | ||
| Majority | 126 | 8.3 | |||
| Turnout | 1,526 | ||||
| Conservative gain from Liberal Democrats | Swing | ||||
| Party | Candidate | Votes | % | ±% | |
|---|---|---|---|---|---|
| Liberal Democrats | 720 | 58.7 | +58.7 | ||
| Labour | 483 | 39.4 | -39.8 | ||
| Conservative | 23 | 1.9 | -18.9 | ||
| Majority | 237 | 19.3 | |||
| Turnout | 1,226 | ||||
| Liberal Democrats gain from Labour | Swing | ||||
| Party | Candidate | Votes | % | ±% | |
|---|---|---|---|---|---|
| Labour | 574 | 58.0 | -21.3 | ||
| Liberal Democrats | 391 | 39.5 | +18.8 | ||
| Conservative | 24 | 2.4 | +2.4 | ||
| Majority | 183 | 18.5 | |||
| Turnout | 989 | 30.0 | |||
| Labour hold | Swing | ||||
| Party | Candidate | Votes | % | ±% | |
|---|---|---|---|---|---|
| Liberal Democrats | Leslie Cassie | 473 | 40.7 | +0.3 | |
| Conservative | David Bawn | 304 | 26.2 | +3.8 | |
| Green | Nicholas Best | 154 | 13.3 | -3.0 | |
| Labour | Ian Fleming | 144 | 12.4 | -8.5 | |
| Independent | John Beynon | 87 | 7.5 | +7.5 | |
| Majority | 169 | 14.5 | -3.5 | ||
| Turnout | 1,162 | 33.9 | -34.0 | ||
| Liberal Democrats hold | Swing | ||||
References
- ^ "The Northumberland (Electoral Changes) Order 2011", legislation.gov.uk, The National Archives, SI 2011/2, retrieved 15 August 2022
- ^ "Compositions calculator". The Elections Centre. Retrieved 10 August 2022.
- ^ "Local election results: Northumberland". Election 2005. BBC News Online. 6 May 2005. Retrieved 30 January 2012.
- ^ "Northumberland". Elections 2008. BBC News Online. 6 May 2008. Retrieved 30 January 2012.
- ^ "Council minutes". Northumberland County Council. Retrieved 15 August 2022.
- ^ O'Connell, Ben (30 January 2019). "Leader and deputy leader of Labour opposition on Northumberland County Council to stand down". Chronicle Live. Retrieved 15 August 2022.
