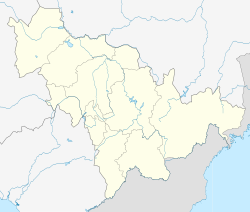
Da'an, Jilin
Jump to navigation
Jump to search
Da'an
大安市 | |
|---|---|
 Location of the city | |
| Coordinates: 45°30′N 124°17′E / 45.500°N 124.283°ECoordinates: 45°30′N 124°17′E / 45.500°N 124.283°E | |
| Country | People's Republic of China |
| Province | Jilin |
| Prefecture-level city | Baicheng |
| Area | |
| • County-level city | 4,879.0 km2 (1,883.8 sq mi) |
| • Urban | 200.00 km2 (77.22 sq mi) |
| Elevation | 137 m (449 ft) |
| Population (2017)[1] | |
| • County-level city | 438,000 |
| • Density | 90/km2 (230/sq mi) |
| • Urban | 159,200 |
| Time zone | UTC+8 (China Standard) |
Da'an (Chinese: 大安; pinyin: Dà'ān; lit. 'Dalai and Anchang') is a city of northwestern Jilin province in Northeast China, on the southern bank of the Songhua River and the border with Heilongjiang province. It is under the administration of Baicheng City, 115 kilometres (71 mi) to the west, and lies 57 kilometres (35 mi) northwest of Songyuan.
Administrative divisions
There are five subdistricts, 10 towns, 16 townships, and one ethnic township.[2]
Subdistricts:
- Anbei Subdistrict (安北街道), Jinhua Subdistrict (锦华街道), Linjiang Subdistrict (临江街道), Huiyang Subdistrict (慧阳街道), Changhong Subdistrict (长虹街道)
Towns:
- Yueliangpao (月亮泡镇), Anchang (安广镇), Fengshou (丰收镇), Xinping'an (新平安镇), Liangjiazi (两家子镇), Sheli (舍力镇), Dagangzi (大岗子镇), Chagan (叉干镇), Longzhao (龙沼镇)
Townships:
- Sikeshu Township (四棵树乡), Lianhe Township (联合乡), Taishan Township (太山乡), Sidawa Township (西大洼乡), Lesheng Township (乐胜乡), Xinhuang Township (新荒乡), Dalai Township (大赉乡), Honggangzi Township (红岗子乡), Tongjian Township (同建乡), Laifu Township (来福乡), Liuhe Township (六合乡), Gucheng Township (古城乡), Shaoguozhen Township (烧锅镇乡), Dayushu Township (大榆树乡), Haituo Township (海坨乡), Jingshan Township (静山乡), Xin'aili Mongol Ethnic Township (新艾里蒙古族乡)
Climate
| Climate data for Da'an (1981−2010) | |||||||||||||
|---|---|---|---|---|---|---|---|---|---|---|---|---|---|
| Month | Jan | Feb | Mar | Apr | May | Jun | Jul | Aug | Sep | Oct | Nov | Dec | Year |
| Record high °C (°F) | 3.2 (37.8) |
12.9 (55.2) |
21.1 (70.0) |
32.0 (89.6) |
36.8 (98.2) |
39.0 (102.2) |
37.5 (99.5) |
36.4 (97.5) |
33.2 (91.8) |
27.6 (81.7) |
17.5 (63.5) |
8.3 (46.9) |
39.0 (102.2) |
| Average high °C (°F) | −10.6 (12.9) |
−4.8 (23.4) |
3.7 (38.7) |
14.3 (57.7) |
21.8 (71.2) |
26.8 (80.2) |
28.1 (82.6) |
26.9 (80.4) |
21.5 (70.7) |
12.6 (54.7) |
0.5 (32.9) |
−8.3 (17.1) |
11.0 (51.9) |
| Daily mean °C (°F) | −16.9 (1.6) |
−11.6 (11.1) |
−2.7 (27.1) |
7.8 (46.0) |
15.7 (60.3) |
21.4 (70.5) |
23.6 (74.5) |
22.1 (71.8) |
15.7 (60.3) |
6.7 (44.1) |
−4.9 (23.2) |
−13.9 (7.0) |
5.2 (41.5) |
| Average low °C (°F) | −21.8 (−7.2) |
−17.2 (1.0) |
−8.6 (16.5) |
1.4 (34.5) |
9.4 (48.9) |
15.9 (60.6) |
19.1 (66.4) |
17.5 (63.5) |
10.0 (50.0) |
1.4 (34.5) |
−9.5 (14.9) |
−18.5 (−1.3) |
−0.1 (31.9) |
| Record low °C (°F) | −37.3 (−35.1) |
−36.4 (−33.5) |
−23.6 (−10.5) |
−8.9 (16.0) |
−1.6 (29.1) |
4.7 (40.5) |
10.6 (51.1) |
7.3 (45.1) |
−2.1 (28.2) |
−17.5 (0.5) |
−25.3 (−13.5) |
−33.9 (−29.0) |
−37.3 (−35.1) |
| Average precipitation mm (inches) | 2.0 (0.08) |
1.6 (0.06) |
6.5 (0.26) |
18.3 (0.72) |
29.3 (1.15) |
69.6 (2.74) |
133.4 (5.25) |
95.9 (3.78) |
32.2 (1.27) |
16.5 (0.65) |
5.7 (0.22) |
3.6 (0.14) |
414.6 (16.32) |
| Average relative humidity (%) | 65 | 58 | 49 | 46 | 49 | 61 | 75 | 75 | 66 | 59 | 60 | 66 | 61 |
| Source: China Meteorological Data Service Center[3] | |||||||||||||
References
- ^ a b Ministry of Housing and Urban-Rural Development, ed. (2019). China Urban Construction Statistical Yearbook 2017. Beijing: China Statistics Press. p. 50. Archived from the original on 18 June 2019. Retrieved 11 January 2020.
- ^ 白城市-行政区划网 www.xzqh.org
- ^ 中国地面气候标准值月值(1981-2010) (in Simplified Chinese). China Meteorological Data Service Center. Retrieved 24 August 2022.
External links
Categories:
- CS1 uses Chinese-language script (zh)
- CS1 Simplified Chinese-language sources (zh-hans)
- Articles with short description
- Short description with empty Wikidata description
- Articles containing Chinese-language text
- Coordinates not on Wikidata
- AC with 0 elements
- Da'an, Jilin
- County-level divisions of Jilin
- All stub articles
- Jilin geography stubs
