Amber Valley Borough Council elections
Amber Valley Borough Council elections are generally held three years out of every four, with a third of the council elected each time. Amber Valley Borough Council is the local authority for the non-metropolitan district of Amber Valley in Derbyshire, England. Since the last boundary changes in 2000, 45 councillors have been elected to represent 23 wards.[1] New ward boundaries are due to come into force from the 2023 elections.[2]
Political control
The first election to the council was held in 1973, initially operating as a shadow authority before coming into its powers on 1 April 1974. Since 1973 political control of the council has been held by the following parties:[3][4]
| Party in control | Years | |
|---|---|---|
| Labour | 1973–1976 | |
| No overall control | 1976–1980 | |
| Labour | 1980–1987 | |
| No overall control | 1987–1988 | |
| Conservative | 1988–1991 | |
| Labour | 1991–2000 | |
| Conservative | 2000–2014 | |
| Labour | 2014–2015 | |
| Conservative | 2015–2019 | |
| Labour | 2019–2021 | |
| Conservative | 2021–present | |
Leadership
The leaders of the council since 2003 have been:[5]
| Councillor | Party | From | To | |
|---|---|---|---|---|
| Alan Cox | Conservative | pre-2003 | 17 Dec 2007 | |
| Stuart Bradford | Conservative | 17 Dec 2007 | 11 Jun 2014 | |
| Paul Jones | Labour | 11 Jun 2014 | 20 May 2015 | |
| Alan Cox | Conservative | 20 May 2015 | 8 May 2016 | |
| Kevin Buttery | Conservative | 25 May 2016 | 22 May 2019 | |
| Chris Emmas-Williams | Labour | 22 May 2019 | 9 May 2021 | |
| Kevin Buttery | Conservative | 19 May 2021 | ||
Council election results
The party make up of the council after each election is as shown below.
| Election | Labour | Conservative | British National Party | Green Party | Independent | Total |
|---|---|---|---|---|---|---|
| 1995 | 37 | 6 | 0 | 0 | 0 | 43 |
| 1996 | 37 | 6 | 0 | 0 | 0 | 43 |
| 1998 | 37 | 6 | 0 | 0 | 0 | 43 |
| 1999 | 32 | 11 | 0 | 0 | 0 | 43 |
| 2000 | 12 | 32 | 0 | 0 | 1 | 45 |
| 2002 | 19 | 26 | 0 | 0 | 0 | 45 |
| 2003 | 25 | 20 | 0 | 0 | 0 | 45 |
| 2004 | 24 | 21 | 0 | 0 | 0 | 45 |
| 2006 | 18 | 27 | 0 | 0 | 0 | 45 |
| 2007 | 17 | 28 | 0 | 0 | 0 | 45 |
| 2008 | 14 | 29 | 2 | 0 | 0 | 45 |
| 2010 | 14 | 29 | 2 | 0 | 0 | 45 |
| 2011 | 15 | 28 | 2 | 0 | 0 | 45 |
| 2012 | 21 | 24 | 0 | 0 | 0 | 45 |
| 2014 | 23 | 22 | 0 | 0 | 0 | 45 |
| 2015 | 21 | 24 | 0 | 0 | 0 | 45 |
| 2016 | 22 | 23 | 0 | 0 | 0 | 45 |
| 2018 | 20 | 25 | 0 | 0 | 0 | 45 |
| 2019 | 25 | 19 | 0 | 1 | 0 | 45 |
| 2021 | 16 | 28 | 0 | 1 | 0 | 45 |
| 2022 | 11 | 30 | 0 | 3 | 1 | 45 |
Council elections
- 1973 Amber Valley District Council election
- 1976 Amber Valley District Council election
- 1979 Amber Valley District Council election (New ward boundaries)[6]
- 1980 Amber Valley District Council election
- 1982 Amber Valley District Council election
- 1983 Amber Valley District Council election
- 1984 Amber Valley District Council election
- 1986 Amber Valley District Council election (District boundary changes took place but the number of seats remained the same)[7]
- 1987 Amber Valley District Council election
- 1988 Amber Valley District Council election
- 1990 Amber Valley Borough Council election
- 1991 Amber Valley Borough Council election
- 1992 Amber Valley Borough Council election
- 1994 Amber Valley Borough Council election (Borough boundary changes took place but the number of seats remained the same)[8]
- 1995 Amber Valley Borough Council election
- 1996 Amber Valley Borough Council election
- 1998 Amber Valley Borough Council election
- 1999 Amber Valley Borough Council election
- 2000 Amber Valley Borough Council election (New ward boundaries increased the number of seats by two)[9]
- 2002 Amber Valley Borough Council election
- 2003 Amber Valley Borough Council election
- 2004 Amber Valley Borough Council election
- 2006 Amber Valley Borough Council election
- 2007 Amber Valley Borough Council election
- 2008 Amber Valley Borough Council election
- 2010 Amber Valley Borough Council election
- 2011 Amber Valley Borough Council election
- 2012 Amber Valley Borough Council election
- 2014 Amber Valley Borough Council election
- 2015 Amber Valley Borough Council election
- 2016 Amber Valley Borough Council election
- 2018 Amber Valley Borough Council election
- 2019 Amber Valley Borough Council election
- 2021 Amber Valley Borough Council election
- 2022 Amber Valley Borough Council election
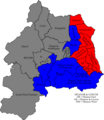
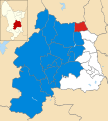
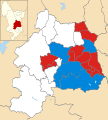
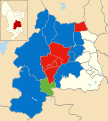
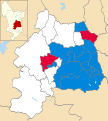
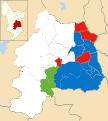
Borough result maps
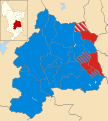
2000 results map
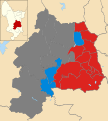
2002 results map
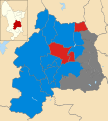
2003 results map
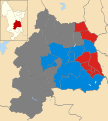
2004 results map
2006 results map

2007 results map

2008 results map

2011 results map

2012 results map

2014 results map
2015 results map
2016 results map

2018 results map
2019 results map
2021 results map
2022 results map


By-election results
1994-2000
| Party | Candidate | Votes | % | ±% | |
|---|---|---|---|---|---|
| Conservative | 619 | 48.2 | |||
| Labour | 545 | 42.5 | |||
| Liberal Democrats | 119 | 9.3 | |||
| Majority | 74 | 5.7 | |||
| Turnout | 1,164 | 24.0 | |||
| Conservative gain from Labour | Swing | ||||
1997-2001
| Party | Candidate | Votes | % | ±% | |
|---|---|---|---|---|---|
| Labour | 354 | 76.5 | -8.3 | ||
| Liberal Democrats | 109 | 23.5 | +8.3 | ||
| Majority | 245 | 53.0 | |||
| Turnout | 463 | 11.8 | |||
| Labour hold | Swing | ||||
| Party | Candidate | Votes | % | ±% | |
|---|---|---|---|---|---|
| Conservative | 372 | 44.7 | +4.2 | ||
| Labour | 259 | 31.1 | -23.1 | ||
| Independent | 165 | 19.8 | +19.8 | ||
| Liberal Democrats | 36 | 4.3 | -2.8 | ||
| Majority | 113 | 13.6 | |||
| Turnout | 832 | 45.0 | |||
| Conservative gain from Labour | Swing | ||||
| Party | Candidate | Votes | % | ±% | |
|---|---|---|---|---|---|
| Conservative | 673 | 68.8 | +23.3 | ||
| Labour | 305 | 31.2 | -23.3 | ||
| Majority | 368 | 37.6 | |||
| Turnout | 978 | 22.9 | |||
| Conservative gain from Labour | Swing | ||||
2000-2006
| Party | Candidate | Votes | % | ±% | |
|---|---|---|---|---|---|
| Conservative | 618 | 53.8 | -3.9 | ||
| Labour | 531 | 46.2 | +10.2 | ||
| Majority | 87 | 7.6 | |||
| Turnout | 1,149 | 28.0 | |||
| Conservative hold | Swing | ||||
| Party | Candidate | Votes | % | ±% | |
|---|---|---|---|---|---|
| Conservative | 557 | 52.3 | +3.6 | ||
| Labour | 381 | 35.8 | +5.7 | ||
| Liberal Democrats | Tony Cooper | 127 | 11.9 | -9.3 | |
| Majority | 176 | 16.5 | |||
| Turnout | 1,065 | 24.0 | |||
| Conservative hold | Swing | ||||
| Party | Candidate | Votes | % | ±% | |
|---|---|---|---|---|---|
| Labour | Alan Longdon | 570 | 42.0 | -11.9 | |
| BNP | Paul Snell | 411 | 30.2 | +30.2 | |
| Conservative | Jean Parry | 317 | 23.3 | -22.8 | |
| Liberal Democrats | Sally McIntosh | 61 | 4.5 | +4.5 | |
| Majority | 159 | 11.8 | |||
| Turnout | 1,359 | 33.0 | |||
| Labour hold | Swing | ||||
2006-2010
| Party | Candidate | Votes | % | ±% | |
|---|---|---|---|---|---|
| Labour | Lyndsay D Cox | 585 | 52.4 | +23.7 | |
| Conservative | Matthew C Joyes | 531 | 47.6 | -1.7 | |
| Majority | 54 | 4.9 | |||
| Turnout | 1,116 | 24.1 | |||
| Labour hold | Swing | 12.6% | |||
2010-2014
| Party | Candidate | Votes | % | ±% | |
|---|---|---|---|---|---|
| Labour | Isobel Harry (E) | 557 | 52.3 | -5.8 | |
| UKIP | Garry Smith | 250 | 23.5 | +9.6 | |
| Conservative | Ron Ashton | 219 | 20.6 | -3.3 | |
| Liberal Democrats | Keith Falconbridge | 39 | 3.7 | +3.7 | |
| Majority | 307 | 28.8 | |||
| Turnout | 26.8 | ||||
| Labour hold | Swing | ||||
| Party | Candidate | Votes | % | ±% | |
|---|---|---|---|---|---|
| Labour | Sheila Oaks (E) | 548 | 58.4 | +8.4 | |
| Conservative | Steven Grainger | 350 | 37.3 | +11.0 | |
| Liberal Democrats | Kate Smith | 41 | 4.4 | -0.2 | |
| Majority | 198 | 21.1 | |||
| Turnout | 18.6 | ||||
| Labour hold | Swing | ||||
| Party | Candidate | Votes | % | ±% | |
|---|---|---|---|---|---|
| Labour | Celia Cox (E) | 595 | 52.9 | -3.3 | |
| UKIP | Philip Rose | 259 | 23.0 | +23.0 | |
| Conservative | Mark Burrell | 229 | 20.4 | -5.2 | |
| Liberal Democrats | Kate Smith | 41 | 3.6 | +3.6 | |
| Majority | 336 | 29.9 | |||
| Turnout | 23.3 | ||||
| Labour hold | Swing | ||||
References
- ^ "The Borough of Amber Valley (Electoral Changes) Order 1999", legislation.gov.uk, The National Archives, SI 1999/2690, retrieved 21 August 2022
- ^ "The Amber Valley (Electoral Changes) Order 2022", legislation.gov.uk, The National Archives, SI 2022/810, retrieved 21 August 2022
- ^ "Compositions calculator". The Elections Centre. Retrieved 20 August 2022.
- ^ "Amber Valley". BBC News Online. 19 April 2008. Retrieved 25 March 2010.
- ^ "Council minutes". Amber Valley Borough Council. Retrieved 21 August 2022.
- ^ The District of Amber Valley (Electoral Arrangements) Order 1978
- ^ The Derbyshire and Nottinghamshire (Areas) Order 1985
- ^ legislation.gov.uk - The Derbyshire and Nottinghamshire (County Boundaries) Order 1992. Retrieved on 5 November 2015.
- ^ "Amber Valley". BBC Online. Retrieved 7 August 2008.
- ^ "Swing to Labour reverses Tory lead". guardian.co.uk. London. 21 June 2002. Retrieved 25 March 2010.
- ^ "Tories make first gain of Cameron era". guardian.co.uk. London. 9 December 2005. Retrieved 5 September 2009.
- ^ "New gloss hides old race claims". Nottingham Evening Post. 3 February 2006.
- ^ "Ripley and Marehay by-election results announced". thisis derbyshire.co.uk. 18 September 2009. Retrieved 21 September 2009.