Selkirk (provincial electoral district)
 | |||
| Provincial electoral district | |||
| Legislature | Legislative Assembly of Manitoba | ||
| MLA |
Progressive Conservative | ||
| District created | 1957 | ||
| First contested | 1958 | ||
| Last contested | 2019 | ||
| Demographics | |||
| Population (2016) | 22,030 | ||
| Electors (2019) | 15,964 | ||
| Area (km²) | 827 | ||
| Pop. density (per km²) | 26.6 | ||
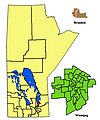
Selkirk is a provincial electoral division in the Canadian province of Manitoba. It was created by redistribution in 1957 from part of St. Andrews, and has formally existed since the provincial election of 1958. It is named after the city of Selkirk, which in turn was named for Thomas Douglas, 5th Earl of Selkirk, who set up the Red River Colony colonization project in 1811.
Selkirk is bordered to the east by Lac Du Bonnet, to the south by Springfield, to the west by Gimli, and to the north by Lake Winnipeg.
Most of the riding's population is located in the city of Selkirk. Other communities in the riding include Belair and Grand Marais, and there is a significant amount of agricultural land in the riding as well.
The riding's population in 1996 was 19,409. In 1999, the average family income was $51,605, and the unemployment rate was 8.30%. Health and social services account for 16% of all industry in the riding.
Thirteen per cent of Selkirk's residents are aboriginal, while 8% are Ukrainian and 6% German.
The riding was safe for the New Democratic Party from 1969 to 2016, although the Liberal Party held the seat from 1988 to 1990. Former Premier of Manitoba Howard Pawley represented Selkirk from 1969 to 1988.
The current MLA is Progressive Conservative Alan Lagimodiere, who was first elected in 2016 in the wave that saw his party win government. He is the first Tory to win the seat.
List of provincial representatives
| Name | Party | Took Office | Left Office |
|---|---|---|---|
| Thomas Hillhouse | Lib-Prog | 1958 | 1961 |
| Lib | 1961 | 1969 | |
| Howard Pawley | NDP | 1969 | 1988 |
| Gwen Charles | Lib | 1988 | 1990 |
| Greg Dewar | NDP | 1990 | 2016 |
| Alan Lagimodiere | PC | 2016 | present |
Electoral results
| 2019 Manitoba general election | ||||||||
|---|---|---|---|---|---|---|---|---|
| Party | Candidate | Votes | % | ±% | Expenditures | |||
| Progressive Conservative | Alan Lagimodiere | 4,736 | 51.21 | -4.29 | $26,525.81 | |||
| New Democratic | Mitch Obach | 3,319 | 35.89 | +7.87 | $23,914.53 | |||
| Green | Tony Hill | 713 | 7.71 | New | $256.70 | |||
| Liberal | Philip Olcen | 480 | 5.19 | -11.27 | $0.00 | |||
| Total valid votes | 100.0 | |||||||
| Total rejected ballots | ||||||||
| Turnout | ||||||||
| Eligible voters | ||||||||
| 2016 Manitoba general election | ||||||||
|---|---|---|---|---|---|---|---|---|
| Party | Candidate | Votes | % | ±% | ||||
| Progressive Conservative | Alan Lagimodiere | 4,686 | 55.50 | +16.42 | ||||
| New Democratic | Greg Dewar | 2,366 | 28.02 | -27.57 | ||||
| Liberal | Stefan Jones | 1,390 | 16.46 | +11.90 | ||||
| Total valid votes | 8,442 | 100.0 | ||||||
| Eligible voters | 13,989 | |||||||
| Source: Elections Manitoba[1][2] | ||||||||
| 2011 Manitoba general election | ||||||||
|---|---|---|---|---|---|---|---|---|
| Party | Candidate | Votes | % | ±% | Expenditures | |||
| New Democratic | Greg Dewar | 4,279 | 55.59 | +0.33 | $23,425.03 | |||
| Progressive Conservative | David Bell | 3,008 | 39.08 | +3.51 | $23,284.05 | |||
| Liberal | Marilyn Courchene | 351 | 4.56 | −3.93 | $356.19 | |||
| Total valid votes | 7,638 | |||||||
| Rejected and declined ballots | 59 | |||||||
| Turnout | 7,697 | 54.77 | −4.41 | |||||
| Source: Elections Manitoba[3] | ||||||||
| 2007 Manitoba general election | ||||||||
|---|---|---|---|---|---|---|---|---|
| Party | Candidate | Votes | % | ±% | Expenditures | |||
| New Democratic | Greg Dewar | 4,584 | 55.26 | $16,897.63 | ||||
| Progressive Conservative | Gordie Dehn | 2,951 | 35.57 | $20,947.84 | ||||
| Liberal | Karen Keppler | 704 | 8.49 | – | $10,032.84 | |||
| Total valid votes | 8,239 | 99.31 | ||||||
| Rejected and declined ballots | 57 | |||||||
| Turnout | 8,296 | 59.18% | ||||||
| Electors on the lists | 14,018 | |||||||
June, 2003:[5]
- (x)Greg Dewar (NDP) 4580
- Jack Jonasson (L) 1469
- Doug Neal (PC) 1257
| 1999 Manitoba general election | ||||||||
|---|---|---|---|---|---|---|---|---|
| Party | Candidate | Votes | % | ±% | Expenditures | |||
| New Democratic | Greg Dewar | 5,376 | 53.92 | $645.00 | ||||
| Progressive Conservative | Barry Uskiw | 3,353 | 33.63 | $30,085.86 | ||||
| Liberal | Joe Smolinski | 1,162 | 11.65 | – | $10,422.27 | |||
| Total valid votes | 9,881 | 99.10 | ||||||
| Rejected and declined ballots | 80 | |||||||
| Turnout | 9,971 | 73.37% | ||||||
| Electors on the lists | 13,590 | |||||||
| 1990 Manitoba general election | ||||||||
|---|---|---|---|---|---|---|---|---|
| Party | Candidate | Votes | % | ±% | ||||
| New Democratic | Greg Dewar | 3,735 | 36.58 | +2.94 | ||||
| Progressive Conservative | Russ Farrell | 3,467 | 33.95 | +4.92 | ||||
| Liberal | Gwen Charles | 3,009 | 29.47 | -5.88 | ||||
| Turnout | 10,242 | 74.44 | -6.02 | |||||
| New Democratic gain from Liberal | Swing | +4.41 | ||||||
| Source: Elections Manitoba[7] | ||||||||
| 1988 Manitoba general election | ||||||||
|---|---|---|---|---|---|---|---|---|
| Party | Candidate | Votes | % | ±% | ||||
| Liberal | Gwen Charles | 3,821 | 35.35 | +24.41 | ||||
| New Democratic | Terry Sargeant | 3,637 | 33.64 | -21.29 | ||||
| Progressive Conservative | Eugene Kinaschuk | 3,138 | 29.03 | -4.33 | ||||
| Western Independence | Ruth Van Koeveringe | 214 | 1.98 | n/a | ||||
| Turnout | 10,820 | 80.46 | +5.53 | |||||
| Liberal gain from New Democratic | Swing | +22.85 | ||||||
| Source: Elections Manitoba[8] | ||||||||
| 1986 Manitoba general election | ||||||||
|---|---|---|---|---|---|---|---|---|
| Party | Candidate | Votes | % | ±% | ||||
| New Democratic | Howard Pawley | 5,135 | 54.93 | -9.17 | ||||
| Progressive Conservative | Eugene Kinaschuk | 3,119 | 33.36 | -1.05 | ||||
| Liberal | Gwen Charles | 1,023 | 10.94 | n/a | ||||
| Progressive | Raye Porhownik | 72 | 0.77 | -0.72 | ||||
| Turnout | 9,368 | 74.93 | -0.10 | |||||
| New Democratic hold | Swing | -4.06 | ||||||
| Source: Elections Manitoba[9] | ||||||||
Previous boundaries

The 1998-2011 boundaries for Selkirk highlighted in red.
The 2011-2019 boundaries for Selkirk highlighted in red.

References
- ^ "Candidates: 41st General Election". Elections Manitoba. March 29, 2016. Retrieved March 31, 2016.
- ^ "41ST GENERAL ELECTION, APRIL 19, 2016 - OFFICIAL RESULTS". Elections Manitoba. April 19, 2016. Retrieved November 12, 2016.
- ^ "Election Returns: 40th General Election". Elections Manitoba. 2011. Retrieved September 13, 2018.
- ^ - 2007 results Archived 2012-04-03 at the Wayback Machine
- ^ "Selkirk — Official Results — 2003 Provincial Elections". Elections.mb.ca. June 3, 2003. Retrieved December 21, 2011.
- ^ - 1999 Results Archived 2011-09-28 at the Wayback Machine
- ^ "Historical Summary" (PDF). Retrieved November 30, 2018.
- ^ "Candidates: 34th General Election" (PDF). Elections Manitoba. April 26, 1988. Retrieved October 2, 2018.
- ^ "Historical Summary" (PDF). Retrieved November 30, 2018.