Solar flare
.jpg)
| Part of a series of articles about |
| Heliophysics |
|---|
 |
A solar flare is an intense localized eruption of electromagnetic radiation in the Sun's atmosphere.[1] Flares occur in active regions and are often, but not always, accompanied by coronal mass ejections, solar particle events, and other solar phenomena. The occurrence of solar flares varies with the 11-year solar cycle.
Solar flares are thought to occur when stored magnetic energy in the Sun's atmosphere accelerates charged particles in the surrounding plasma. This results in the emission of electromagnetic radiation across the electromagnetic spectrum.
High-energy electromagnetic radiation from solar flares is absorbed by the daylight side of Earth's upper atmosphere, in particular the ionosphere, and does not reach the surface. This absorption can temporarily increase the ionization of the ionosphere which may interfere with short-wave radio communication. The prediction of solar flares is an active area of research.
Flares also occur on other stars, where the term stellar flare applies.
Description
Solar flares affect all layers of the solar atmosphere (photosphere, chromosphere, and corona). The plasma medium is heated to tens of millions of kelvins, while electrons, protons, and heavier ions are accelerated to near the speed of light. Flares produce electromagnetic radiation across the electromagnetic spectrum at all wavelengths, from radio waves to gamma rays. Most of the energy is spread over frequencies outside the visual range; the majority of the flares are not visible to the naked eye and must be observed with special instruments. Flares occur in active regions often around sunspots, where intense magnetic fields penetrate the photosphere to link the corona to the solar interior. Flares are powered by the sudden (timescales of minutes to tens of minutes) release of magnetic energy stored in the corona. The same energy releases may produce coronal mass ejections (CMEs), although the relationship between CMEs and flares is still not well understood.[citation needed]
Solar flares occur in a power-law spectrum of magnitudes; an energy release of typically 1020 joules of energy suffices to produce a clearly observable event, while a major event can emit up to 1025 joules.[2]
Associated with solar flares are flare sprays.[3] They involve faster ejections of material than eruptive prominences,[4] and reach velocities of 20 to 2000 kilometers per second.[5]
Frequency
The frequency of occurrence of solar flares varies with the 11-year solar cycle. It can range from several per day during solar maximum to less than one every week during solar minimum. Additionally, more powerful flares are less frequent than weaker ones. For example, X10-class (severe) flares occur on average about eight times per cycle, whereas M1-class (minor) flares occur on average about 2000 times per cycle.[6]
Erich Rieger discovered with coworkers in 1984 an approximately 154 day period in the occurrence of gamma-ray emitting solar flares at least since the solar cycle 19.[7] The period has since been confirmed in most heliophysics data and the interplanetary magnetic field and is commonly known as the Rieger period. The period's resonance harmonics also have been reported from most data types in the heliosphere.
Duration
The duration of a solar flare depends heavily on the wavelength of the electromagnetic radiation used in its calculation. This is due to different wavelengths being emitted through different processes and at different heights in the Sun's atmosphere.
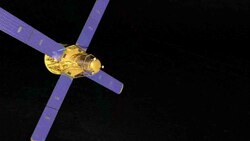
A common measure of flare duration is the full width at half maximum (FWHM) time of soft X-ray flux within the wavelength bands 0.05 to 0.4 and 0.1 to 0.8 nanometres (0.5 to 4 and 1 to 8 ångströms) measured by the GOES spacecraft in geosynchronous orbit. The FWHM time spans from when a flare's flux first reaches halfway between its maximum flux and the background flux and when it again reaches this value as the flare decays. Using this measure, the duration of a flare ranges from approximately tens of seconds to several hours with a median duration of approximately 6 and 11 minutes in the 0.05 to 0.4 and 0.1 to 0.8 nanometre bands, respectively.[8][9]
Solar flares lasting longer than approximately 30 minutes are regarded as long duration events (LDE).[10][11][better source needed]
Post-eruption loops and arcades

After the eruption of a solar flare, post-eruption loops made up of hot plasma begin to form across the neutral line separating regions of opposite magnetic polarity near the flare's source. These loops extend from the photosphere up into the corona and form along the neutral line at increasingly greater distances from the source as time progresses.[13] The existence of these hot loops is thought to be continued by prolonged heating present after the eruption and during the flare's decay stage.[14]
In sufficiently powerful flares, typically of C-class or higher, the loops may combine to form an elongated arch-like structure known as a post-eruption arcade. These structures may last anywhere from multiple hours to multiple days after the initial flare.[13] In some cases, dark sunward-traveling plasma voids known as supra-arcade downflows may form above these arcades.[15]
Cause
Flares occur when accelerated charged particles, mainly electrons, interact with the plasma medium. Evidence suggests that the phenomenon of magnetic reconnection leads to this extreme acceleration of charged particles.[16] On the Sun, magnetic reconnection may happen on solar arcades – a series of closely occurring loops following magnetic lines of force. These lines of force quickly reconnect into a lower arcade of loops leaving a helix of magnetic field unconnected to the rest of the arcade. The sudden release of energy in this reconnection is the origin of the particle acceleration. The unconnected magnetic helical field and the material that it contains may violently expand outwards forming a coronal mass ejection.[17] This also explains why solar flares typically erupt from active regions on the Sun where magnetic fields are much stronger.
Although there is a general agreement on the source of a flare's energy, the mechanisms involved are still not well understood. It's not clear how the magnetic energy is transformed into the kinetic energy of the particles, nor is it known how some particles can be accelerated to the GeV range (109 electron volt) and beyond. There are also some inconsistencies regarding the total number of accelerated particles, which sometimes seems to be greater than the total number in the coronal loop. Scientists are unable to forecast flares.[citation needed]
Classification
Soft X-ray classification
The modern classification system for solar flares uses the letters A, B, C, M, or X, according to the peak flux in watts per square metre (W/m2) of soft X-rays with wavelengths 0.1 to 0.8 nanometres (1 to 8 ångströms), as measured by the GOES spacecraft in geosynchronous orbit.
| Classification | Approximate peak flux range at 0.1-0.8 nanometre (watts/square metre) |
|---|---|
| A | < 10−7 |
| B | 10−7 – 10−6 |
| C | 10−6 – 10−5 |
| M | 10−5 – 10−4 |
| X | > 10−4 |
The strength of an event within a class is noted by a numerical suffix ranging from 1 up to, but excluding, 10,[18] which is also the factor for that event within the class. Hence, an X2 flare is twice the strength of an X1 flare, an X3 flare is three times as powerful as an X1, and only 50% more powerful than an X2.[19] An X2 is four times more powerful than an M5 flare.[20] X-class flares with a peak flux that exceeds 10−3 W/m2 may be noted with a numerical suffix equal to or greater than 10.
This system was originally devised in 1970 and included only the letters C, M, and X. These letters were chosen to avoid confusion with other optical classification systems. The A and B classes would later be added in the 1990s as instruments became more sensitive to weaker flares. Around the same time, the backronym moderate for M-class flares and extreme for X-class flares began to be used.[21]
H-alpha classification
An earlier flare classification was based on H-alpha spectral observations. The scheme uses both the intensity and emitting surface. The classification in intensity is qualitative, referring to the flares as: faint (f), normal (n) or brilliant (b). The emitting surface is measured in terms of millionths of the hemisphere and is described below. (The total hemisphere area AH = 15.5 × 10¹² km2.)
| Classification | Corrected area (millionths of hemisphere) |
|---|---|
| S | < 100 |
| 1 | 100–250 |
| 2 | 250–600 |
| 3 | 600–1200 |
| 4 | > 1200 |
A flare then is classified taking S or a number that represents its size and a letter that represents its peak intensity, v.g.: Sn is a normal sunflare.[22]
Effects

Terrestrial
X-rays and extreme ultraviolet radiation emitted by solar flares are absorbed by the daylight side of Earth's atmosphere and do not reach the Earth's surface. Therefore, solar flares pose no direct danger to humans on Earth. However, this absorption of high-energy electromagnetic radiation can temporarily increase the ionization of the upper atmosphere, which can interfere with short-wave radio communication, and can temporarily heat and expand the Earth's outer atmosphere. This expansion can increase drag on satellites in low Earth orbit, which can lead to orbital decay over time.[23]
Radio blackouts
The temporary increase in ionization of the daylight side of Earth's atmosphere, in particular the D layer of the ionosphere, can interfere with short-wave radio communications that rely on its level of ionization for skywave propagation. Skywave, or skip, refers to the propagation of radio waves reflected or refracted off of the ionized ionosphere. When ionization is higher than normal, radio waves get degraded or completely absorbed by losing energy from the more frequent collisions with free electrons.[1]
The level of ionization of the atmosphere correlates with the strength of the associated solar flare in soft X-ray radiation. The NOAA classifies radio blackouts by the peak soft X-ray intensity of the associated flare.
| Classification | Associated solar flare | Description[24] |
|---|---|---|
| R1 | M1 | Minor radio blackout |
| R2 | M5 | Moderate radio blackout |
| R3 | X1 | Strong radio blackout |
| R4 | X10 | Severe radio blackout |
| R5 | X20 | Extreme radio blackout |
Magnetic crochet
The increased ionization of the D and E layers of the ionosphere caused by large solar flares increases the electrical conductivity of these layers allowing for the flow of electric currents. These ionospheric currents induce a magnetic field which can be measured by ground-based magnetometers. This phenomenon is known as a magnetic crochet or solar flare effect (SFE).[25] The former name derives from its appearance on magnetometers resembling a crochet hook.[citation needed] These disturbances are relatively minor compared to those induced by geomagnetic storms.
In space
For astronauts in space,[where?] an expected radiation dose from the electromagnetic radiation emitted during a solar flare is about 0.05 gray, which is not immediately lethal on its own. Of much more concern for astronauts is the particle radiation associated with solar particle events.[26][better source needed]
Observations
Flares produce radiation across the electromagnetic spectrum, although with different intensity. They are not very intense in visible light, but they can be very bright at particular spectral lines. They normally produce bremsstrahlung in X-rays and synchrotron radiation in radio.[citation needed]
History
Optical observations

Solar flares were first observed by Richard Carrington and Richard Hodgson independently on 1 September 1859 by projecting the image of the solar disk produced by an optical telescope through a broad-band filter. It was an extraordinarily intense white light flare, a flare emitting a high amount of light in the visual spectrum.[27]
Since flares produce copious amounts of radiation at H-alpha,[citation needed] adding a narrow (≈1 Å) passband filter centered at this wavelength to the optical telescope allows the observation of not very bright flares with small telescopes. For years Hα was the main, if not the only, source of information about solar flares. Other passband filters are also used.
Radio observations
During World War II, on February 25 and 26, 1942, British radar operators observed radiation that Stanley Hey interpreted as solar emission. Their discovery did not go public until the end of the conflict. The same year Southworth also observed the Sun in radio, but as with Hey, his observations were only known after 1945. In 1943 Grote Reber was the first to report radioastronomical observations of the Sun at 160 MHz. The fast development of radioastronomy revealed new peculiarities of the solar activity like storms and bursts related to the flares. Today ground-based radiotelescopes observe the Sun from c. 15 MHz up to 400 GHz.
Space telescopes
Because the Earth's atmosphere absorbs much of the electromagnetic radiation emitted by the Sun with wavelengths shorter than 300 nm, space-based telescopes allowed for the observation of solar flares in previously unobserved high-energy spectral lines. Since the 1970s, the GOES series of satellites have been continuously observing the Sun in soft X-rays, and their observations have become the standard measure of flares, diminishing the importance of the H-alpha classification. Additionally, space-based telescopes allow for the observation of extremely long wavelengths—as long as a few kilometres—which cannot propagate through the ionosphere.
Examples of large solar flares

The most powerful flare ever observed is thought to be the flare associated with the 1859 Carrington Event.[29][30] While no soft X-ray measurements were made at the time, the magnetic crochet associated with the flare was recorded by ground-based magnetometers allowing the flare's strength to be estimated after the event. Using these magnetometer readings, its soft X-ray class has been estimated to be greater than X10.[31] The soft X-ray class of the flare has also been estimated to be around X50.[32][better source needed]
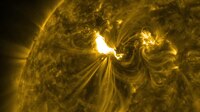
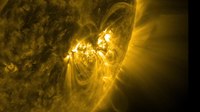
In modern times, the largest solar flare measured with instruments occurred on 4 November 2003. This event saturated the GOES detectors, and because of this its classification is only approximate. Initially, extrapolating the GOES curve, it was estimated to be X28.[33] Later analysis of the ionospheric effects suggested increasing this estimate to X45.[34] This event produced the first clear evidence of a new spectral component above 100 GHz.[35]
Other large solar flares also occurred on 2 April 2001 (X20+),[36] 28 October 2003 (X17.2+ and 10),[37] 7 September 2005 (X17),[36] 9 August 2011 (X6.9),[38][39] 7 March 2012 (X5.4),[40][41] and 6 September 2017 (X9.3).[42]
Prediction
Current methods of flare prediction are problematic, and there is no certain indication that an active region on the Sun will produce a flare. However, many properties of sunspots and active regions correlate with flaring. For example, magnetically complex regions (based on line-of-sight magnetic field) called delta spots produce the largest flares. A simple scheme of sunspot classification due to McIntosh, or related to fractal complexity[43] is commonly used as a starting point for flare prediction.[44] Predictions are usually stated in terms of probabilities for occurrence of flares above M- or X-class within 24 or 48 hours. The U.S. National Oceanic and Atmospheric Administration (NOAA) issues forecasts of this kind.[45] MAG4 was developed at the University of Alabama in Huntsville with support from the Space Radiation Analysis Group at Johnson Space Flight Center (NASA/SRAG) for forecasting M- and X-class flares, CMEs, fast CME, and Solar Energetic Particle events.[46] A physics-based method that can predict imminent large solar flares was proposed by Institute for Space-Earth Environmental Research (ISEE), Nagoya University.[47]
In popular culture
A solar flare has been the main plot device for science fiction stories:
- Flare, a 1992 novel by Roger Zelazny and Thomas Thurston Thomas
- Inconstant Moon, a 1996 Outer Limits episode on Showtime by writer Larry Niven and starring Michael Gross and Joanna Gleason
- Tamizhuku En Ondrai Azhuthavum, a 2015 tamil language film directed by Ramprakash Rayappa and starring Nakul
- Every Little Thing, the season two premiere of the a 2019 AppleTV+ series For All Mankind created by Ronald D. Moore, Matt Wolpert and Ben Nedivi
- Finch, a 2021 AppleTV+ film directed by Miguel Sapochnik and starring Tom Hanks
- Stowaway, a 2021 science-fiction thriller film by Joe Penna and Ryan Morrison
- COBRA, a 2020 British TV series in which a huge flare strikes Europe, damaging the UK's power grid and navigation systems, starring Robert Carlyle and Victoria Hamilton
They are also a popular doomsday scenario in disaster films, where their effects on Earth are often greatly exaggerated.[48]
See also
References
- ^ a b "Solar Flares (Radio Blackouts) | NOAA / NWS Space Weather Prediction Center". www.swpc.noaa.gov. Retrieved 11 November 2021.
- ^ "What is a Solar Flare?". NASA. Retrieved May 12, 2016.
- ^ Morimoto, Tarou; Kurokawa, Hiroki. "Effects of Magnetic and Gravity forces on the Acceleration of Solar Filaments and Coronal Mass Ejections" (PDF). Archived from the original (PDF) on 2011-06-11. Retrieved 2009-10-08.
- ^ Tandberg-Hanssen, E.; Martin, Sara F.; Hansen, Richard T. (March 1980). "Dynamics of flare sprays". Solar Physics. 65 (2): 357–368. Bibcode:1980SoPh...65..357T. doi:10.1007/BF00152799. ISSN 0038-0938. S2CID 122385884.
- ^ "NASA Visible Earth: Biggest Solar Flare on Record". nasa.gov. 15 May 2001.
- ^ "NOAA Space Weather Scales | NOAA / NWS Space Weather Prediction Center". www.swpc.noaa.gov. Retrieved 20 November 2021.
- ^ Rieger, E.; Share, G. H.; Forrest, D. J.; Kanbach, G.; Reppin, C.; Chupp, E. L. (1984). "A 154-day periodicity in the occurrence of hard solar flares?". Nature. 312 (5995): 623–625. Bibcode:1984Natur.312..623R. doi:10.1038/312623a0. S2CID 4348672.
- ^ Reep, Jeffrey W.; Knizhnik, Kalman J. (3 April 2019). "What Determines the X-Ray Intensity and Duration of a Solar Flare?". The Astrophysical Journal. 874 (2): 157. arXiv:1903.10564. Bibcode:2019ApJ...874..157R. doi:10.3847/1538-4357/ab0ae7. S2CID 85517195. Retrieved 18 April 2022.
- ^ Reep, Jeffrey W.; Barnes, Will T. (October 2021). "Forecasting the Remaining Duration of an Ongoing Solar Flare". Space Weather. 19 (10). arXiv:2103.03957. Bibcode:2021SpWea..1902754R. doi:10.1029/2021SW002754. S2CID 237709521. Retrieved 18 April 2022.
- ^ "Space Weather Glossary | NOAA / NWS Space Weather Prediction Center". www.swpc.noaa.gov. Retrieved 18 April 2022.
- ^ "The duration of solar flares | STCE". www.stce.be. Retrieved 18 April 2022.
- ^ Brian, Handy; Hudson, Hugh. "SUPER REGIONS". solar.physics.montana.edu. Retrieved 23 December 2021.
- ^ a b Livshits, M. A.; Urnov, A. M.; Goryaev, F. F.; Kashapova, L. K.; Grigor’eva, I. Yu.; Kal’tman, T. I. (October 2011). "Physics of post-eruptive solar arcades: Interpretation of RATAN-600 and STEREO spacecraft observations". Astronomy Reports. 55 (10): 918–927. Bibcode:2011ARep...55..918L. doi:10.1134/S1063772911100064. S2CID 121487634. Retrieved 23 December 2021.
- ^ Grechnev, V. V.; Kuzin, S. V.; Urnov, A. M.; Zhitnik, I. A.; Uralov, A. M.; Bogachev, S. A.; Livshits, M. A.; Bugaenko, O. I.; Zandanov, V. G.; Ignat’ev, A. P.; Krutov, V. V.; Oparin, S. N.; Pertsov, A. A.; Slemzin, V. A.; Chertok, I. M.; Stepanov, A. I. (July 2006). "Long-lived hot coronal structures observed with CORONAS-F/SPIRIT in the Mg XII line". Solar System Research. 40 (4): 286–293. Bibcode:2006SoSyR..40..286G. doi:10.1134/S0038094606040046. S2CID 121291767. Retrieved 23 December 2021.
- ^ Savage, Sabrina L.; McKenzie, David E. (2011-04-01). "Quantitative Examination of a Large Sample of Supra-Arcade Downflows in Eruptive Solar Flares". The Astrophysical Journal. 730 (2): 98. arXiv:1101.1540. Bibcode:2011ApJ...730...98S. doi:10.1088/0004-637x/730/2/98. S2CID 119273860.
- ^ Zhu et al., ApJ, 2016, 821, L29
- ^ "The Mysterious Origins of Solar Flares", Scientific American, April 2006
- ^ "Strong M9.9 solar flare erupted from AR 1936". The Watchers. January 2014. Retrieved 29 October 2021.
- ^ Garner, Rob (6 September 2017). "Sun Erupts With Significant Flare". NASA. Retrieved 2 June 2019.
- ^ Schrijver, Carolus J.; Siscoe, George L., eds. (2010), Heliophysics: Space Storms and Radiation: Causes and Effects, Cambridge University Press, p. 375, ISBN 978-1107049048
- ^ Pietrow, A.G.M. (2022). Physical properties of chromospheric features: Plage, peacock jets, and calibrating it all (PhD). Stockholm University. doi:10.13140/RG.2.2.36047.76968.
- ^ Tandberg-Hanssen, Einar; Emslie, A. Gordon (1988). Cambridge University Press (ed.). "The physics of solar flares".
- ^ "The Impact of Flares". Retrieved 23 December 2021.
- ^ "NOAA Space Weather Scales". NOAA SWPC. Retrieved 14 January 2022.
- ^ Thompson, Richard. "A Solar Flare Effect". Space Weather Services. Bureau of Meteorology. Retrieved 12 May 2022.
- ^ Whittaker, Ian. "The invisible space killers - The dangers of space radiation from both inside and outside the solar system". Physiology News Magazine. doi:10.36866/pn.117.36. S2CID 214067105. Retrieved 14 June 2022.
- ^ a b "Description of a Singular Appearance seen in the Sun on September 1, 1859", Monthly Notices of the Royal Astronomical Society, v20, pp13+, 1859
- ^ "Extreme Space Weather Events". National Geophysical Data Center. Archived from the original on May 22, 2012. Retrieved May 21, 2012.
- ^ "A Super Solar Flare". NASA. 6 May 2008. Retrieved 22 December 2012.
- ^ Bell, Trudy E.; Phillips, Tony (2008). "A Super Solar Flare". Science@NASA. Retrieved May 21, 2012.
- ^ Cliver, E.W.; Svalgaard, L. (2004). "The 1859 solar–terrestrial disturbance and the current limits of extreme space weather activity" (PDF). Archived from the original (PDF) on 2011-08-11. Retrieved 2011-04-22.
- ^ Woods, Tom. "Solar Flares" (PDF). Retrieved 24 November 2019.
- ^ "SOHO Hotshots". Sohowww.nascom.nasa.gov. Retrieved May 21, 2012.
- ^ "Biggest ever solar flare was even bigger than thought | SpaceRef – Your Space Reference". SpaceRef. 2004-03-15. Retrieved May 21, 2012.
- ^ Kaufmann, Pierre; Raulin, Jean-Pierre; Giménez de Castro, C. G.; Levato, Hugo; Gary, Dale E.; Costa, Joaquim E. R.; Marun, Adolfo; Pereyra, Pablo; Silva, Adriana V. R.; Correia, Emilia (March 10, 2004). "A new solar burst spectral component emitting only in the terahertz range" (PDF). The Astrophysical Journal. 603 (2): 121–124. Bibcode:2004ApJ...603L.121K. doi:10.1086/383186. S2CID 54878789. Retrieved November 22, 2014.
- ^ a b "BIGGEST SOLAR X-RAY FLARE ON RECORD – X20". NASA. Retrieved May 21, 2012.
- ^ "X 17.2 AND 10.0 FLARES!". NASA. Retrieved May 21, 2012.
- ^ Fox, Karen C.; Hendrix, Susan (August 9, 2011). "Sun Unleashes X6.9 Class Flare". NASA Goddard Space Flight Center. Retrieved April 10, 2021.
- ^ Bergen, Jennifer. "Sun fires powerful X6.9-class solar flare". Geek.com. Archived from the original on October 18, 2012. Retrieved May 21, 2012.
- ^ Zalaznick, Matt (8 March 2012). "Gimme Some Space: Solar Flare, Solar Storm Strike". The Norwalk Daily Voice. Retrieved July 19, 2012.
- ^ "Geomagnetic Storm Strength Increases". NASA. Retrieved July 9, 2012.
- ^ "Two Significant Solar Flares Imaged by NASA's SDO". 6 September 2017. Retrieved 6 September 2017.
- ^ McAteer, James (2005). "Statistics of Active Region Complexy". The Astrophysical Journal. 631 (2): 638. Bibcode:2005ApJ...631..628M. doi:10.1086/432412.
- ^ Wheatland, M. S. (2008). "A Bayesian approach to solar flare prediction". The Astrophysical Journal. 609 (2): 1134–1139. arXiv:astro-ph/0403613. Bibcode:2004ApJ...609.1134W. doi:10.1086/421261. S2CID 10273389.
- ^ "Space Weather Prediction Center". NOAA. Retrieved August 1, 2012.
- ^ Falconer (2011), A tool for empirical forecasting of major flares,coronal mass ejections, and solar particle eventsfrom a proxy of active-region free magnetic energy (PDF)
- ^ Kusano, Kanya; Iju, Tomoya; Bamba, Yumi; Inoue, Satoshi (July 31, 2020). "A physics-based method that can predict imminent large solar flares". Science. 369 (6503): 587–591. Bibcode:2020Sci...369..587K. doi:10.1126/science.aaz2511. PMID 32732427.
- ^ ""Knowing" How Solar Flares Don't Work". 23 August 2009.
External links
- NOAA Space Weather Prediction Center's near real-time solar flare data and resources:
- NASA Astronomy Picture of the Day: An X Class Flare Region on the Sun (6 November 2007)

- Articles with short description
- All articles with unsourced statements
- Articles with unsourced statements from November 2021
- All articles lacking reliable references
- Articles lacking reliable references from April 2022
- Articles with unsourced statements from August 2013
- Articles with unsourced statements from May 2022
- Vague or ambiguous geographic scope from June 2022
- Articles lacking reliable references from June 2022
- Articles lacking reliable references from May 2022
- AC with 0 elements
- Solar phenomena
- Space plasmas
- Plasma physics
- Articles containing video clips
- Cosmic doomsday