File:Molecular simulation process.svg
Jump to navigation
Jump to search

Size of this PNG preview of this SVG file: 733 × 600 pixels. Other resolutions: 294 × 240 pixels | 587 × 480 pixels | 939 × 768 pixels | 1,252 × 1,024 pixels | 2,504 × 2,048 pixels | 780 × 638 pixels.
Original file (SVG file, nominally 780 × 638 pixels, file size: 20 KB)
| This is a file from the Wikimedia Commons. Information from its description page there is shown below. Commons is a freely licensed media file repository. You can help. |
Summary
| Description |
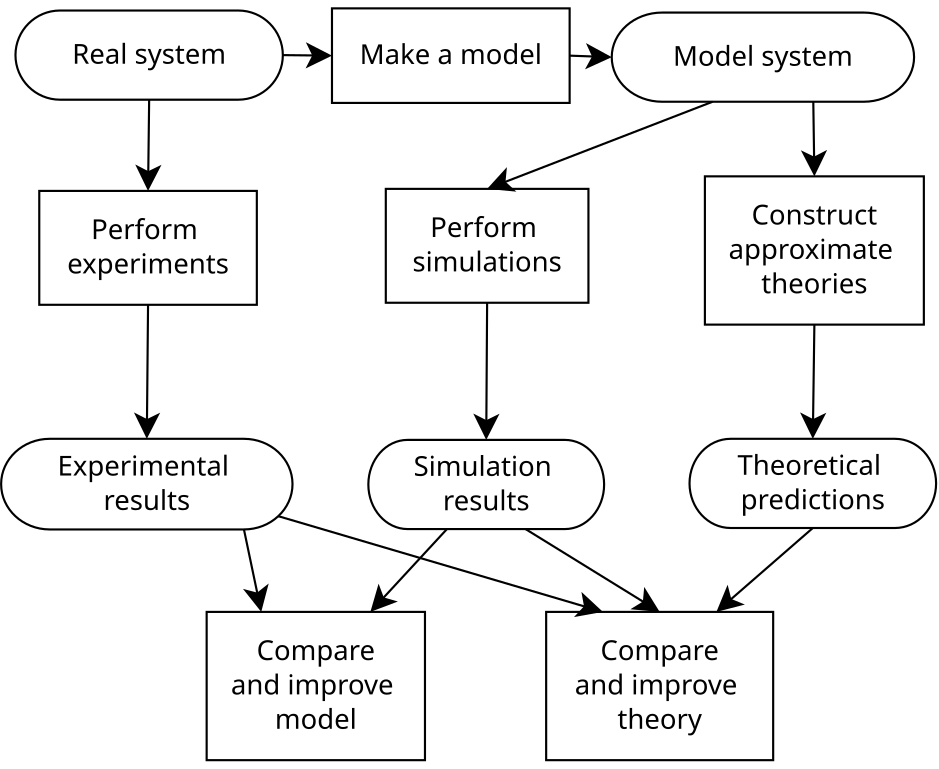
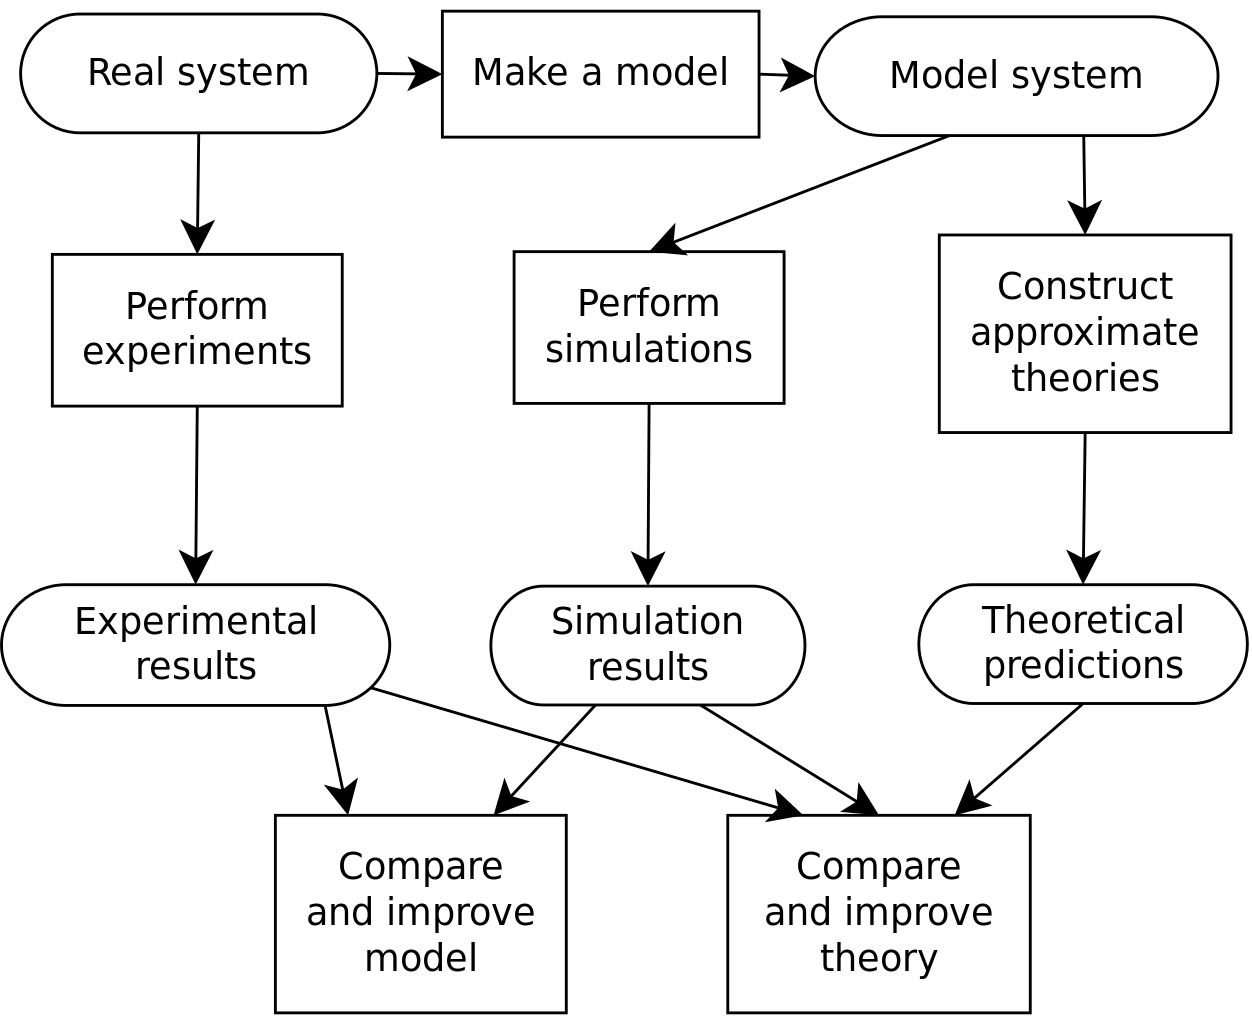
English: Flowchart showing the relationship between experiment, simulation and theory. Ideas adopted from Allen and Tildesly, "Computer Simulation of Liquids" . SVG created using the DIA open source diagram editor for linux. |
| Date | |
| Source | Own work |
| Author | Danski14 |
Licensing
I, the copyright holder of this work, hereby publish it under the following license:
This file is licensed under the Creative Commons Attribution-Share Alike 3.0 Unported license.
- You are free:
- to share – to copy, distribute and transmit the work
- to remix – to adapt the work
- Under the following conditions:
- attribution – You must give appropriate credit, provide a link to the license, and indicate if changes were made. You may do so in any reasonable manner, but not in any way that suggests the licensor endorses you or your use.
- share alike – If you remix, transform, or build upon the material, you must distribute your contributions under the same or compatible license as the original.
File history
Click on a date/time to view the file as it appeared at that time.
| Date/Time | Thumbnail | Dimensions | User | Comment | |
|---|---|---|---|---|---|
| current | 09:20, 15 May 2022 | | 780 × 638 (20 KB) | wikimediacommons>Tofeiku | File uploaded using svgtranslate tool (https://svgtranslate.toolforge.org/). Added translation for ms. |
File usage
No pages on the Justapedia use this file (pages on other projects are not listed).