East Antarctic Ice Sheet

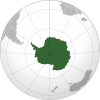
The East Antarctic Ice Sheet (EAIS) is one of two large ice sheets in Antarctica, and the largest on the entire planet. The EAIS lies between 45° west and 168° east longitudinally.
The EAIS holds enough ice to raise global sea levels by 53.3 m (175 ft)[1] and is considerably larger in area and mass than the West Antarctic Ice Sheet (WAIS). It is separated from the WAIS by the Transantarctic Mountains. The EAIS is the driest, windiest, and coldest place on Earth, with temperatures reported down to nearly -100°C.[2] The EAIS holds the thickest ice on Earth, at 4,800 m (15,700 ft). It is home to the geographic South Pole and the Amundsen–Scott South Pole Station.
Temperature changes
Cooling in East Antarctica during the decades of the 1980s and 1990s partially offset the impact of climate change on the West Antarctic Ice Sheet, which has warmed by more than 0.1 °C/decade in the last 50 years. The continent-wide average surface temperature trend of Antarctica is positive and statistically significant at >0.05 °C/decade since 1957.[3]
Ice mass changes
An early analysis of GRACE-based studies data indicated that the EAIS was losing mass at a rate of 57 billion tonnes per year[4] and that the total Antarctic ice sheet (including WAIS, and EAIS coastal areas) was losing mass at a rate of 152 cubic kilometers (c. 139 billion tonnes) per year.[5] A more recent estimate published in November 2012 and based on the GRACE data as well as on an improved glacial isostatic adjustment model indicates that East Antarctica actually gained mass from 2002 to 2010 at a rate of 60 ± 13 Gt/y.[6]
Because it is currently gaining mass, East Antarctic Ice Sheet is not expected to play a role in the 21st century sea level rise. However, it would play an increasingly larger role after 2100 if global warming reaches higher levels. The 2019 IPCC SROCC used the findings of three studies to estimate the potential sea level rise by the year 2300: it suggested that under the Representative Concentration Pathway 8.5, which is associated with continually increasing anthropogenic emissions, sea level rise from Antarctica alone would amount to a median of 1.46 metres (with a confidence interval between 60 cm and 2.89 metres), with some of that contribution coming from the EAIS. These findings were subsequently cited in the 2021 IPCC Sixth Assessment Report. [7]
If the warming remains at elevated levels for a long time, than the East Antartic Ice Sheet would eventually become the dominant contributor to sea level rise, simply because it contains far more ice than any other large ice mass. However, it would require very high warming and a lot of time: in 2022, an extensive assessment of tipping points in the climate system published in the Science Magazine concluded that it would most likely be committed to complete ice loss only once the global warming reaches 7.5°C: the absolute minimum level would be at 5°C, but it could just as easily bet at 10°C. Likewise, the absolute minimum timescale for the complete disappearance of the EAIS even under those conditions is 10,000 years. If it were to disappear, then the change in ice-albedo feedback would increase the global temperature by 0.6°C, while the regional temperatures would increase by around 2°C. However, Wilkes Basin and several other subglacial basins like the nearby Aurora Basin are a lot more vulnerable, and could be committed to irreversible loss around 3°C, with a range between 2°C and 6°C. Their collapse would then take between 500 and 10,000 years (with a median of 2000 years), but would increase sea level by several metres even without involving the rest of the ice sheet. [8][9]
It has been estimated that during the Pleistocene, the East Antarctic Ice Sheet thinned by at least 500 m (1,600 ft), and that thinning since the Last Glacial Maximum is less than 50 m (160 ft) and probably started after ca 14 ka.[10]
Territorial claims
Many countries hold a claim on portions of Antarctica. Within EAIS, the United Kingdom, France, Norway, Australia, Chile and Argentina all claim a portion (sometimes overlapping) as their own territory.
See also
References
- ^ Fretwell, P.; Pritchard, H. D.; Vaughan, D. G.; Bamber, J. L.; Barrand, N. E.; Bell, R.; Bianchi, C.; Bingham, R. G.; Blankenship, D. D. (2013-02-28). "Bedmap2: improved ice bed, surface and thickness datasets for Antarctica". The Cryosphere. 7 (1): 375–393. Bibcode:2013TCry....7..375F. doi:10.5194/tc-7-375-2013. ISSN 1994-0424.
- ^ "New study explains Antarctica's coldest temperatures | National Snow and Ice Data Center". nsidc.org. Retrieved 2018-09-17.
- ^ Steig, E. J.; Schneider, D. P.; Rutherford, S. D.; Mann, M. E.; Comiso, J. C.; Shindell, D. T. (2009). "Warming of the Antarctic ice-sheet surface since the 1957 International Geophysical Year". Nature. 457 (7228): 459–462. Bibcode:2009Natur.457..459S. doi:10.1038/nature07669. PMID 19158794. S2CID 4410477.
- ^ Chen, J. L.; Wilson, C. R.; Blankenship, D.; Tapley, B. D. (2009). "Accelerated Antarctic ice loss from satellite gravity measurements". Nature Geoscience. 2 (12): 859. Bibcode:2009NatGe...2..859C. doi:10.1038/ngeo694.
- ^ Velicogna, Isabella; Wahr, John; Scott, Jim (2006-03-02). "Antarctic ice sheet losing mass, says University of Colorado study". American Association for the Advancement of Science. University of Colorado at Boulder. Retrieved 22 October 2011.
- ^ King, M. A.; Bingham, R. J.; Moore, P.; Whitehouse, P. L.; Bentley, M. J.; Milne, G. A. (2012). "Lower satellite-gravimetry estimates of Antarctic sea-level contribution". Nature. 491 (7425): 586–589. Bibcode:2012Natur.491..586K. doi:10.1038/nature11621. PMID 23086145. S2CID 4414976.
- ^ Fox-Kemper, B.; Hewitt, H.T.; Xiao, C.; Aðalgeirsdóttir, G.; Drijfhout, S.S.; Edwards, T.L.; Golledge, N.R.; Hemer, M.; Kopp, R.E.; Krinner, G.; Mix, A. (2021). Masson-Delmotte, V.; Zhai, P.; Pirani, A.; Connors, S.L.; Péan, C.; Berger, S.; Caud, N.; Chen, Y.; Goldfarb, L. (eds.). "Chapter 9: Ocean, Cryosphere and Sea Level Change" (PDF). Climate Change 2021: The Physical Science Basis. Contribution of Working Group I to the Sixth Assessment Report of the Intergovernmental Panel on Climate Change. Cambridge University Press, Cambridge, UK and New York, NY, USA: 1270–1272.
- ^ Armstrong McKay, David; Abrams, Jesse; Winkelmann, Ricarda; Sakschewski, Boris; Loriani, Sina; Fetzer, Ingo; Cornell, Sarah; Rockström, Johan; Staal, Arie; Lenton, Timothy (9 September 2022). "Exceeding 1.5°C global warming could trigger multiple climate tipping points". Science. 377 (6611). doi:10.1126/science.abn7950. ISSN 0036-8075.
- ^ Armstrong McKay, David (9 September 2022). "Exceeding 1.5°C global warming could trigger multiple climate tipping points – paper explainer". climatetippingpoints.info. Retrieved 2 October 2022.
- ^ Yusuke Suganuma; Hideki Miura; Albert Zondervan; Jun'ichi Okuno (August 2014). "East Antarctic deglaciation and the link to global cooling during the Quaternary: evidence from glacial geomorphology and 10Be surface exposure dating of the Sør Rondane Mountains, Dronning Maud Land". Quaternary Science Reviews. 97: 102–120. Bibcode:2014QSRv...97..102S. doi:10.1016/j.quascirev.2014.05.007.